Why a Quarterly Snapshot Beats a Single Running Spreadsheet
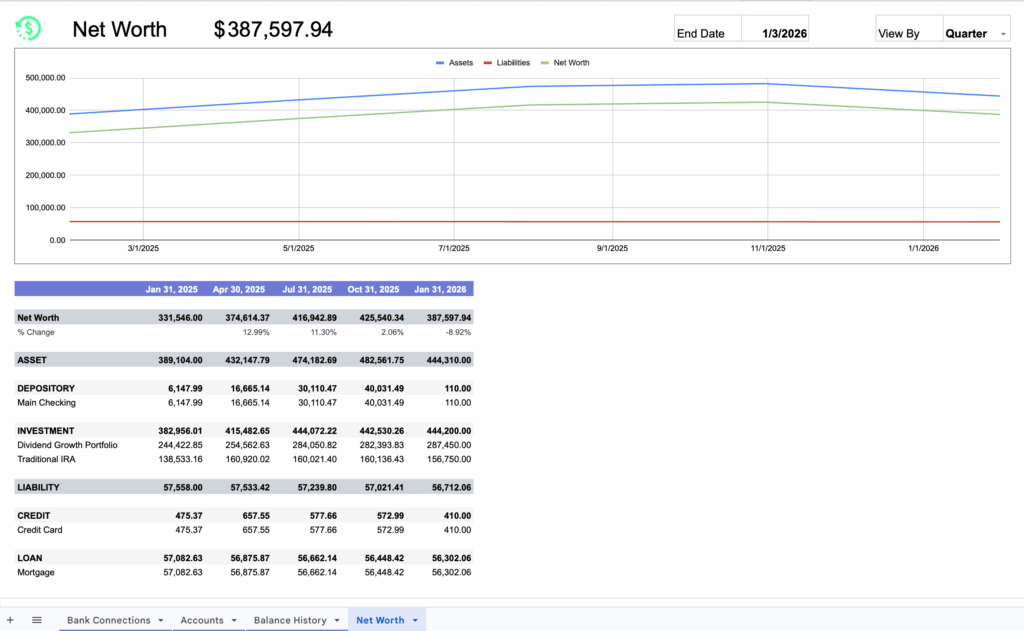
Most people who track net worth in Google Sheets make the same mistake: they keep one live sheet that gets overwritten every time they update a balance. That approach tells you where you are today, but it destroys the history you need to see whether you are actually making progress. A quarterly net worth snapshot solves that problem. Instead of a single mutable number, you build a small series of dated snapshots — one per quarter — so you can compare January to April to July to October and see the trend rather than a point.
The quarterly cadence is deliberate. Monthly tracking often produces noise: a credit card bill lands on the 28th, a paycheck clears on the 1st, and the “net worth” number swings for reasons that have nothing to do with your finances improving. Annual tracking is too sparse to catch problems early. Four snapshots a year is enough to smooth out most timing noise while still giving you timely feedback. A well-structured snapshot template typically separates an assets section, a liabilities section, and a net worth summary strip so the calculation stays obvious and auditable [S1].
Set Up the Workbook Structure Before You Enter a Single Number
The foundation of a reliable snapshot is a workbook with a clear division of labor between input sheets and summary sheets. You want to enter data once, in one place, and have everything else reference it. A practical layout looks like this:
- Settings/Accounts sheet — a master list of every account name, its type (asset or liability), and its category (cash, investments, retirement, property, credit card, loan, mortgage).
- Snapshot sheets — one per quarter, named with an unambiguous convention such as 2025-Q1, 2025-Q2, and so on. Each contains only the balances for that date.
- Summary/Dashboard sheet — pulls totals from every snapshot sheet into a single comparison table and chart.
Naming discipline matters more than most people expect. Use a consistent prefix so the sheets sort chronologically in the tab bar, and never rename a past quarter once it is filled in. If you need to correct a historical figure, add a note rather than silently editing it, because the whole value of the snapshot series depends on trusting the record.
On each snapshot sheet, lay out three blocks top to bottom: assets, liabilities, then the summary strip. Within the assets block, list each account in column A and its balance in column B. Do the same for liabilities. Then the summary strip computes total assets, total liabilities, and net worth. Keeping the three sections physically separate on the page makes it far harder to accidentally add a loan to the asset total — a surprisingly common error in hand-built sheets.
Build the Summary Strip With Simple, Transparent Formulas
Resist the temptation to build one enormous formula. Instead, use SUM ranges that map exactly to the blocks you created. If assets run from row 4 to row 15 in column B, your total assets cell should be something like =SUM(B4:B15). Total liabilities gets its own SUM over the liabilities block. Net worth is then simply =TotalAssets − TotalLiabilities, referencing those two cells rather than re-summing ranges. This structure means that when you add a new account mid-year, you only have to extend one or two ranges, and you can see at a glance whether the math is intact.
Label the summary strip clearly — “Total Assets,” “Total Liabilities,” “Net Worth” — and consider adding a fourth line for “Change Since Last Quarter” that references the prior snapshot sheet directly, for example subtracting last quarter’s net worth cell from this quarter’s. That single line is often the most motivating number in the whole workbook, because it answers the question you actually care about: did this quarter move me forward?
Two formatting habits pay off here. First, apply a consistent currency format to every balance cell so the numbers align and read cleanly. Second, use a subtle fill color for calculated cells and a different one for input cells. Color-coding inputs versus outputs is a low-effort way to prevent someone (including future you) from typing over a formula. If you share the sheet, consider protecting the calculated ranges under Data → Protect sheets and ranges.
Make the Sheet Comfortable to Use: Freezing, Validation, and Templates
A snapshot sheet that is annoying to fill in will get abandoned by the second quarter. Small usability improvements make the difference. Freezing the header rows and the account-name column keeps labels visible while you scroll through a long list of accounts — Google Sheets supports freezing both columns and rows, and the feature exists specifically to keep important information in view as you move around the sheet [S2]. For a snapshot with twenty or more line items, this is close to essential.
Data validation is the next easy win. Restrict the balance columns to numbers so a stray text entry cannot silently break a SUM. If you maintain a category column, use a dropdown list so categories stay consistent across quarters — inconsistent labels are the main reason summary breakdowns by category stop working after a year.
Then there is the question of whether to build from scratch or start from a template. Ready-made planner-style templates exist that include assets, liabilities, and a net worth summary strip, and some are generated to order for a specific device, date range, and language rather than being a one-size-fits-all download [S1]. A template is a reasonable starting point if you want the structure without designing it yourself, but check that it uses plain formulas you can audit rather than opaque scripts. Whatever you start from, the workbook should remain yours to modify: add accounts, change categories, and adjust the layout as your finances evolve.
Finally, consider how often you want to repeat the exercise. Quarterly is the default recommendation here, but the right cadence depends on how volatile your accounts are. Someone with a stable salary and index-fund portfolio can comfortably snapshot quarterly; someone with variable freelance income or active trading may prefer monthly. The structure does not change — only the number of snapshot sheets per year.
A Practical Quarterly Workflow
The snapshot itself should take fifteen to thirty minutes, not an afternoon. A repeatable routine keeps it that way:
- Duplicate the previous quarter’s sheet and rename it for the new quarter. This preserves formatting, formulas, and account lists, so you are only changing numbers.
- Gather balances from each account’s statement or app on a single consistent date — the last day of the quarter is the cleanest choice.
- Enter balances only in the input cells, leaving the summary strip to calculate itself.
- Sanity-check the totals. If net worth moved sharply, identify which line item caused it before moving on. A large unexplained swing usually means a typo.
- Record a one-line note on the snapshot sheet explaining any unusual movement — a bonus, a home repair, a market drop. Future you will thank present you for the context.
- Update the summary sheet so the new quarter appears in the comparison table and chart.
On the summary sheet, a simple table with quarters as rows and Total Assets, Total Liabilities, and Net Worth as columns gives you an at-a-glance history. A line chart of net worth over time, built from that table, turns the numbers into a picture you can actually feel. Keep the chart on the same sheet as the table so it updates automatically as new quarters are added.
Common Mistakes to Avoid
Even with a good structure, a few errors recur. Mixing pre-tax retirement balances with post-tax cash without acknowledging the difference can overstate net worth; at minimum, note the distinction so you interpret the trend correctly. Forgetting to include small accounts — a store card, a minor savings account — creates a slow drift between your snapshot and reality. And overwriting a past snapshot “just this once” undermines the entire exercise; the record is the point.
It is also worth saying plainly that account interfaces, Google Sheets features, and any template you adopt can change over time, and specific menu locations or template availability may differ from what you expect. Treat any instructions here as a structural guide rather than a guarantee of exact current behavior, and verify details in your own copy of Sheets when you build the workbook. The underlying approach — separate input sheets, transparent formulas, a dated series of snapshots, and a summary view — is durable regardless of interface changes.
Build it once, fill it in four times a year, and the snapshot becomes one of the highest-return habits in your personal finance toolkit: a clear, honest, comparable record of where you stand each quarter.
Sources for Editorial Review
These are relevant pages found during drafting, not proof that any claim has been verified. Review factual statements and citations before publication.
- Editorial source lead [S1]: Net Worth Snapshot — planner template · organize.ink (organize.ink)
- Editorial source lead [S2]: How to freeze columns and rows in Google Sheets ? – Kanbanchi (kanbanchi.com)